Table of Contents
Introduction
When you want to profile a JVM application running remotely on a Docker or Linux server, you generally have two options. You can connect to it using some popular profilers like VisualVM (which under the hood uses JMX), or you can manually collect information about running the Java process using JFR technology. The result of such a collection is then saved to a file with the .jfr extension. You can load this file to the profiler of your choice, like VisualVM or another. In this post, I will try to compare those two approaches. I will consider only remote profiling.
Profiling using JMX
To have the possibility to profile a JVM using the JMX protocol, you need to enable it using JVM arguments, or you can enable it dynamically. For JVM arguments, this configuration looks similar to this:
-Dcom.sun.management.jmxremote=true
-Dcom.sun.management.jmxremote.port=1234
-Dcom.sun.management.jmxremote.authenticate=false
-Dcom.sun.management.jmxremote.ssl=false
You can also enable it dynamically, without modifying JVM arguments, using the following command:
 jcmd <jvm_pid> ManagementAgent.start \
    jmxremote.port=1234\
    jmxremote.authenticate=false \
    jmxremote.ssl=false
Besides, you will have to expose the JMX port depending on your network configuration. If you use Kubernetes, then it will require changes in your Kubernetes Service configuration. You should also take into consideration firewalls. It can block the possibility of connecting to the process.

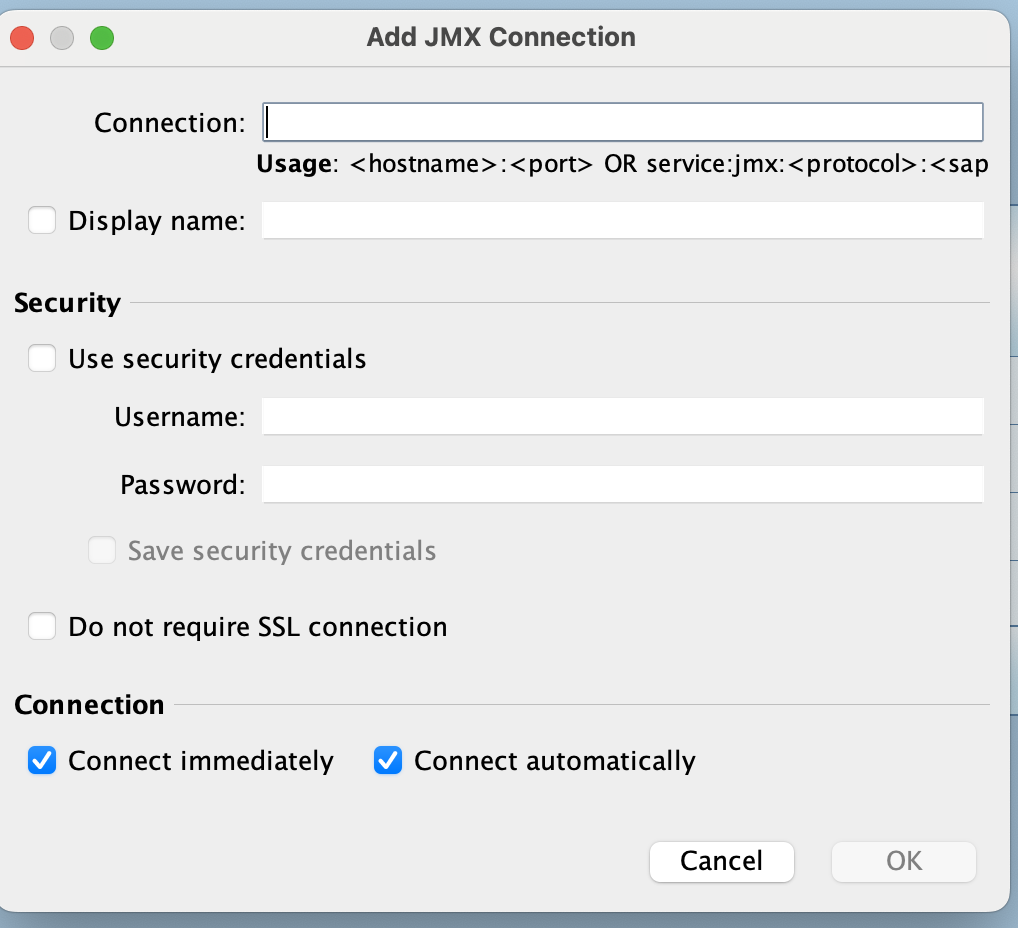
Right-click on the File and then “Add JMX Connection”. After that, you will be prompted to provide the configuration.
Profiling using JFR
When it comes to JFR, the process of profiling looks a little bit different. You must log in to the server where the Java application is deployed. Next, you should get the PID of the Linux Java process. The easiest way to do this is to use the JPS command utility, which is bundled with every Java distribution.

On the left side, you see the PID number. It’s needed to start JFR profiling. For the Docker container, it’s usually the 1. Now, if you have the PID number, you can start profiling. The command is:
jcmd PID JFR.start settings=profile name=customprofiling1 filename=/tmp/record.jfr
where the filename property defines the file location to save recording data. Keep in mind that if your Java process is running on a dedicated Linux user, then executing this command from the root account is enough. You will have to change the command to the following:
sudo -u dedicated_user jcmd PID JFR.start settings=profile name=customprofiling1 filename=/tmp/record.jfr
And now, if you want to stop recording, you can use the command:
jcmd PID JFR.stop name=customprofiling1
Now you can download file /tmp/record.jfr to your local machine and load it to the profiler of your choice. For example, VisualVM.
Primary differences
As you can see from the description above, the most critical factor determining the profiling method is the configuration of your deployment environment. For profiling using JMX, you should have the possibility to establish a network connection from your computer to the application. It usually means that some ports need to be exposed, the firewall needs to allow such network traffic, etc. For JFR, on the other hand, you need the possibility to transfer the JFR file from a Linux server to your local computer. You may also wonder if you can use JFR without a commercial license. If you search in Google for the phrase “Java JFR” as the first result, you will see this page and the following sentence:
JFR is a commercial feature, available only in the commercial packages based on the Java Platform
This is actually not true anymore. JFR was open-sourced starting with Java 11 and then backported to Java 8. So, unless you use a Java 8 distribution from Oracle, you can use JFR without worrying about a commercial license.
Sampling
Sampling works differently for both tools. For JMX, the thread dump is collected using the JVM utility, but for JFR, threads are frozen on the OS level, and then the JVM tries to reconstruct the stack trace by mapping machine instructions to bytecode. In practice, JFR tends to produce more accurate samples unless the JVM doesn’t spend a lot of time executing native code. The important thing is that if you plan to use JFR profiling in particular for sampling (you need stack traces of threads ), then it is highly recommended to run your Java process with two additional command-line flags:
-XX:+UnlockDiagnosticVMOptions -XX:+DebugNonSafepoints
It will highly improve the accuracy of collected stack traces. I am using this option only when I’m doing CPU sampling. In particular, I want to check which Java methods are executed and how fast those methods are executed. If I need only other information, like for example, the memory usage of the program, then it’s not necessary to add those two flags.
Overhead
For JFR, the overhead for recording a standard profiling recording using the default settings is less than 2 percent for most applications.
For JMX, there is no official information about overhead from Oracle. But based on my experience and the information I gathered, JMX doesn’t introduce a big overhead. It can be used even in the production environment for monitoring Java applications. Even CPU sampling, which is performed using the thread dump utility, shouldn’t impact performance. Of course, when we consider default settings.
Summary
To sum it up, these two tools discussed in this article offer similar functionality. A decision on which tool should be used depends on what can be easily used in your remote environment, the place where you deploy your Java app. I personally tend to use JFR because I can create automatic scripts that:
- Enable JFR monitoring in the remote environment.
- Perform some operations like for example, REST requests.
- Disable JFR and transfer the JFR file to my local computer.
Then I can analyze the collected JFR file in VisualVM, and I know that it consists only of data about the operation I would like to analyze (for example, some problematic REST calls)