Table of Contents
- Introduction
- Kubernetes components
- Namespace
- DB Schema
- Recommended resources
- Performance tests of deployment
- Scaling
- Monitoring
- Metrics
- History Shard count
- Resources
Introduction
Deploying a Temporal cluster on Kubernetes involves more than just launching the services. A successful, production-ready setup requires a solid understanding of its core architecture, configuration nuances, and the key metrics needed to maintain its health. This article is intended as a technical breakdown for engineers and operators considering or actively working with Temporal.
I will begin by providing a functional description of each core service.From there, I will address critical operational topics, including the management of namespaces and database schemas. Then I will discuss performance considerations, covering resource allocation, load testing methodologies, and scaling strategies for different workloads. Finally, I will detail the essential metrics for monitoring the cluster’s health, such as State Transition, Schedule-To-Start Latency, and Shard Lock Latency, explaining what they indicate about your system’s performance.
Kubernetes components
Temporal Kubernetes deployment contains the following services:
- Frontend: This service acts as the main entry point for all API requests and client connections to the Temporal cluster. It is a stateless gateway responsible for rate limiting, authorization, routing, and validating incoming calls before they are forwarded to the appropriate internal service.
- History: service is responsible for persisting and managing the state of all workflow executions. It maintains the event history of each workflow, which is the authoritative log of all events that have occurred. This durable history is crucial for the reliability and fault tolerance of Temporal, allowing workflows to be restored and continue execution after any failures.
- Matching: This service manages Task Queues and dispatches tasks to available Workers. When a new workflow task or activity task is created, it is placed on a Task Queue. The Matching service is responsible for efficiently polling these queues and delivering tasks to the correct worker processes that are long-polling for work.
- Worker: Internal workflows, like archival, multi-cluster replication, and managing retention policy for workflows.
- Web: The Web service provides a graphical user interface for observing and debugging workflow executions. It allows you to view the status of workflows, inspect their event histories, and see the details of running and completed tasks, offering insights into the state of your applications. Optional
- Admintools: This service provides command-line tools for administrative tasks within the Temporal cluster. It is primarily used for managing namespaces, viewing cluster health, and performing other operational and administrative functions. These tools are essential for the maintenance and management of the Temporal environment. Optional
- Internal frontend: A dedicated, non-public gateway for Temporal’s own internal system workers (e.g., for archival). This isolates system-level traffic from application traffic, enhancing security and operational stability. It ensures that critical system-level traffic is handled separately from application traffic. Optional
The first four services on this list are essentials, and the biggest focus is on them when we discuss temporal deployment. I prepared a chart that illustrates the flow between all temporal services, including external communication. This is not a detailed instruction, but it gives you an overview.

Namespace
Think of a namespace as a self-contained unit for your workflows. It acts as a boundary, isolating workflow executions, task queues, and configurations. This isolation is crucial for several reasons:
- Multi-tenancy: You can use namespaces to separate different applications, teams, or even deployment environments (like development, staging, and production) within the same Temporal cluster.
- Resource Management: Namespaces prevent a high-traffic workflow in one area from impacting the performance of others. Each namespace has its own set of resources and rate limits.
- Configuration: You can define specific settings at the namespace level, such as the event history retention period for completed workflows and where to archive them.
- Uniqueness: Workflow IDs are guaranteed to be unique only within a single namespace. You can have workflows with the same ID in different namespaces.
Temporal Namespaces can be created directly within a Helm chart’s values.yaml using the syntax:
server:
  config:
    namespaces:
      create: true
      namespace:
        - name: default
It will create a Kubernetes job that will create a namespace with the name “default”.
Consequently, all namespace management is performed using the tctl command-line tool. This presents two primary methods for handling their creation:
- Manual Execution: For quick development or testing, an engineer can connect to the admin-tools pod and run tctl commands directly. This approach, however, is not suitable for production as it lacks an audit trail and is not repeatable.
- Example: tctl namespace register my-new-namespace –retention 7d
- Automated Execution: The recommended production practice is to automate these tctl commands. This is typically done by defining a Kubernetes Job that runs as part of a workflow (e.g., via an Argo CD PostSync hook), ensuring namespace configurations are version-controlled, audited, and applied consistently.
This means we must decide on and implement an automated workflow for managing namespaces to support our production environments.
DB Schema
It’s possible to use our database. Temporal provides a command-line tool:
temporal-sql-tool
which allows you to create a database, create a schema, and update the schema. More information about the tool: sql-tool. You can also manage your temporal DB from the helm level, here is the example:
server:
  config:
    persistence:
      default:
        driver: "sql"
        sql:
          driver: "postgres12"
          host: your-postgres-host
          port: 5432
          database: temporal
          user: postgres
          password: pass
          maxConns: 20
          maxConnLifetime: "1h"
schema:
  createDatabase:
    enabled: true
  setup:
    enabled: true
  update:
    enabled: true
After defining credentials for the DB, you can simply trigger the creation of the database, schema, and database update. Under the hood, it still uses the temporal-sql-tool utility, which is part of the admin-tools Docker image. If you require some more advanced customization, like for example an update to some specific version of DB, you can create a Kubernetes Job, which uses the admin-tools Docker image and runs temporal-sql-tool with your specific arguments.
Some teams wanted to have more control over the migration process, so they created their own tools for database migrations: https://wwarfield.com/2024/08/25/temporal-io-schema-management-postgresql-mysql-and-cassandra/
Recommended resources
Frontend Service: 1.5 to 2 CPU Cores, 4 GiB Memory
History Service: 4 CPU Cores, 6+ GiB Memory (will depend on workloads, try to keep < 70%)
Matching Service: 1 CPU Core, 2 GiB Memory (monitor CPU use)
Worker Service: 0.5 to 1 CPU Cores, 1 GiB Memory (monitor if using lots of schedules)
These are recommended resources for production. For other environments, you can assign fewer resources, but these recommendations should give you a general idea. It means that the history service is both memory-intensive and CPU-intensive among all services.
Performance tests of deployment
After deploying Temporal, you can use performance tools to stress test your Temporal Kubernetes cluster: https://github.com/temporalio/benchmark-workers/blob/main/deployment.yaml. Before running tests, you have to create a default namespace; you can do it using Helm values as we discussed earlier.
You should customize parameters in the deployment.yaml based on the exact traffic you want to simulate. Essential parameters are:
- CONCURRENT_WORKFLOWS:
◦ This parameter sets the number of workflows that the benchmark-soak-test runner will keep active concurrently.
◦ It is the primary control for adjusting the load on your Temporal cluster. Increasing this value simulates higher demand, making the cluster process more concurrent workflows and helping you assess its throughput limits.
- Replicas:
◦ This defines the number of identical instances (pods) for a given deployment.
◦ For benchmark workers, increasing the replica count enables horizontal scaling of your Temporal worker fleet, directly impacting the throughput your application can achieve and reducing task processing latency.
- {“Count”: 3, “Activity”: “Echo”, “Input”: { “Message”: “test” } }:
◦ This JSON snippet represents the input payload for each workflow instance started by the benchmark-soak-test runner.
◦ It dictates the specific type and amount of work each workflow will perform. In this case, each workflow will execute the “Echo” activity 3 times with the input message “test”. Changing the Activity type or Count allows you to simulate different computational loads and test various aspects of the Temporal cluster’s performance.
- TEMPORAL_ACTIVITY_TASK_POLLERS:
◦ This parameter specifies the number of concurrent pollers for activity tasks that each benchmark-worker instance will run.
◦ It directly controls the concurrency of activity task processing within each individual worker pod. Setting this value too low can lead to increased Schedule-to-Start Latency (tasks waiting in the queue), while setting it too high without sufficient underlying worker resources (CPU/memory) can cause resource contention or instability. Tuning this is critical for optimizing worker performance.
Scaling
Each Temporal service type can be scaled independently
Recommendations below are the baseline (scale up ok)
Small Cluster profile (3k st/s)
- Frontend: 3 to 4 replicas
- History: 6 to 8 replicas
- Matching: 3 to 4 replicas
- Worker: 3 replicas
Large Cluster profile (6k st/s):
- Frontend: 6 to 8 replicas
- History: 12 to 14 replicas
- Matching: 6 to 8 replicas
- Worker: 3 replicas
Monitoring
All Temporal services expose a lot of metrics. Scraping for a specific service can be enabled using the following Helm chart value. For example, for the history service, it can be activated using:
server:
  history:
    metrics:
      serviceMonitor:
        enabled: true
As a good starting point, you can use community-driven Grafana dashboards: https://github.com/temporalio/dashboards. And you can customize it later on, during your tests/implementations.
Metrics
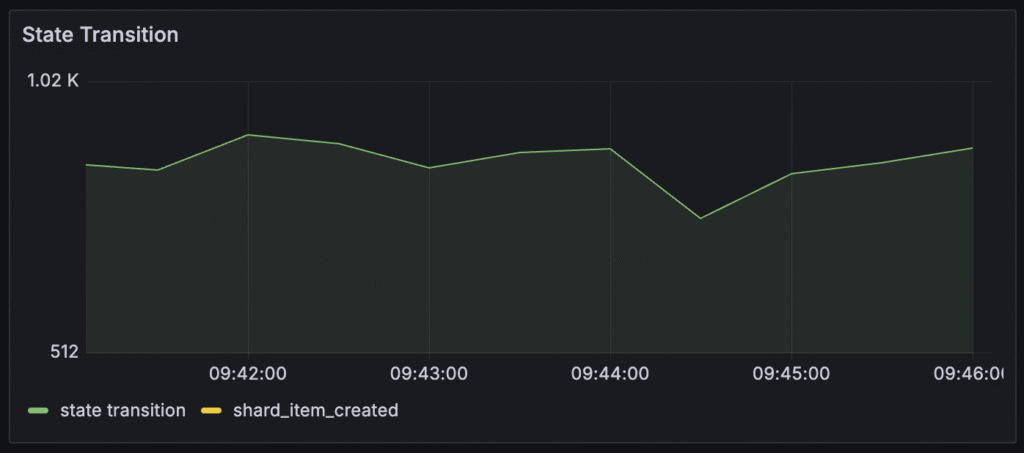
State transition
This metric measures the overall throughput of your Temporal cluster, indicating how much work the server is actively processing. For you, it directly reflects how many operations (like creating or updating workflows) Temporal can handle each second. If this number is lower than expected or drops, it means your system is processing fewer workflows.
It’s the most important metric to follow when you want to have a general overview of a temporal cluster. Recommendations: For a small cluster, you should try to achieve 3000/s, and for a larger cluster, 6000/s. These are recommendations from the Temporal team.
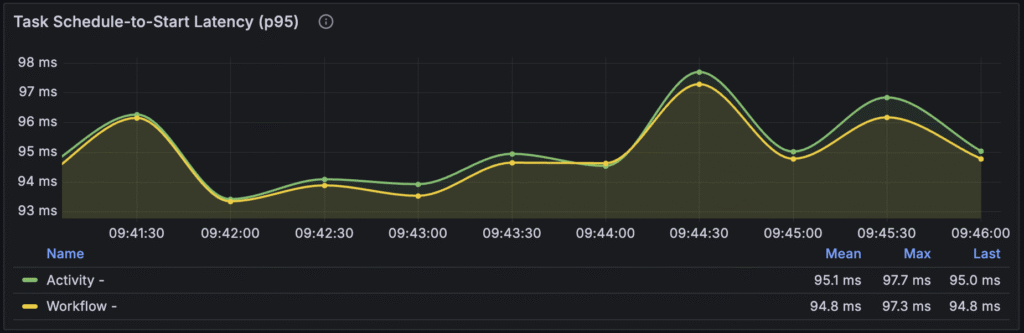
Schedule-To-Start Latency
This metric tracks the delay between when a workflow or activity task is created by the server and when a worker begins processing it. If this latency is high, it indicates that your workers are not picking up tasks quickly enough, either due to being overloaded or misconfigured. This directly translates to delays in the execution of your workflows and activities, affecting your application’s real-time performance.
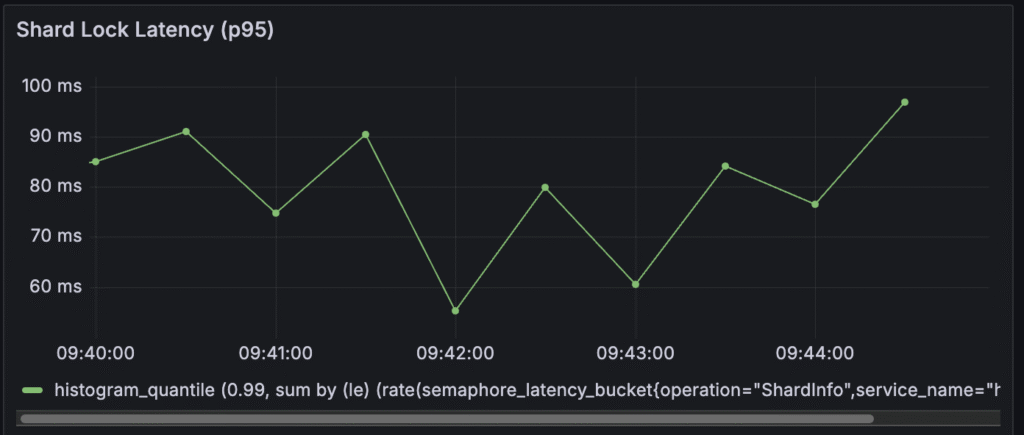
Shard Lock Latency
Temporal uses shards (partitions) to distribute responsibility for workflow histories among History pods and a shard lock must be obtained before a workflow history can be created or updated. High shard lock latency indicates contention and potential overload on your database or history service. From a user’s perspective, this means that even if you have enough overall throughput capacity, individual workflow updates or new workflow starts might be delayed due to internal system bottlenecks, leading to an inconsistent or slower experience for certain operations. It should be below 60ms. Ideally, less than 30ms. Higher values suggest that you might not have enough historical shards configured for the cluster.
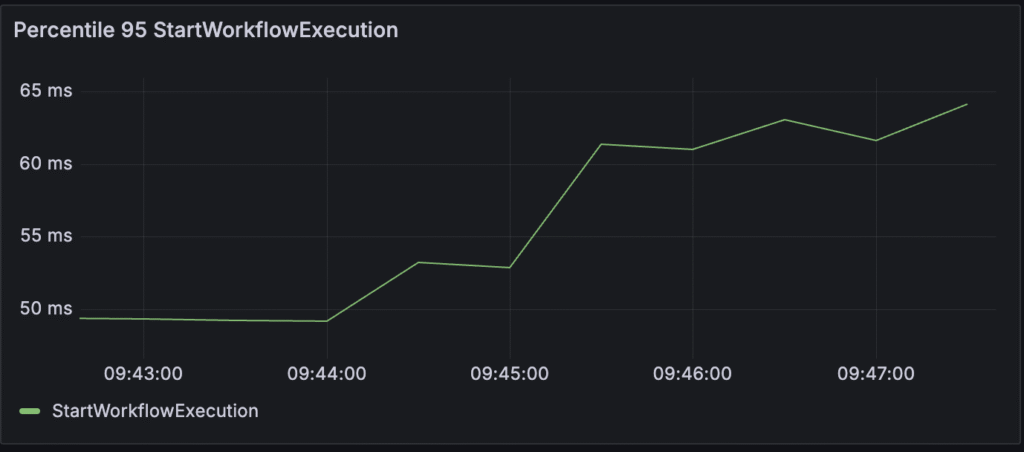
StartWorkflowExecution (Request Latency)
This refers to the request latency for the StartWorkflowExecution operation. Starting workflow is performed directly on the server; it does not include communication with workers, so you can measure how your server is doing.
- What it means to you as a user: This metric directly reflects the time it takes for your application to initiate a new workflow. If this latency is high, it means your users will experience delays when starting new processes or operations that rely on a Temporal workflow, leading to a slow or unresponsive user experience.
- Target: An initial goal for StartWorkflowExecution request latency is less than 150 milliseconds.
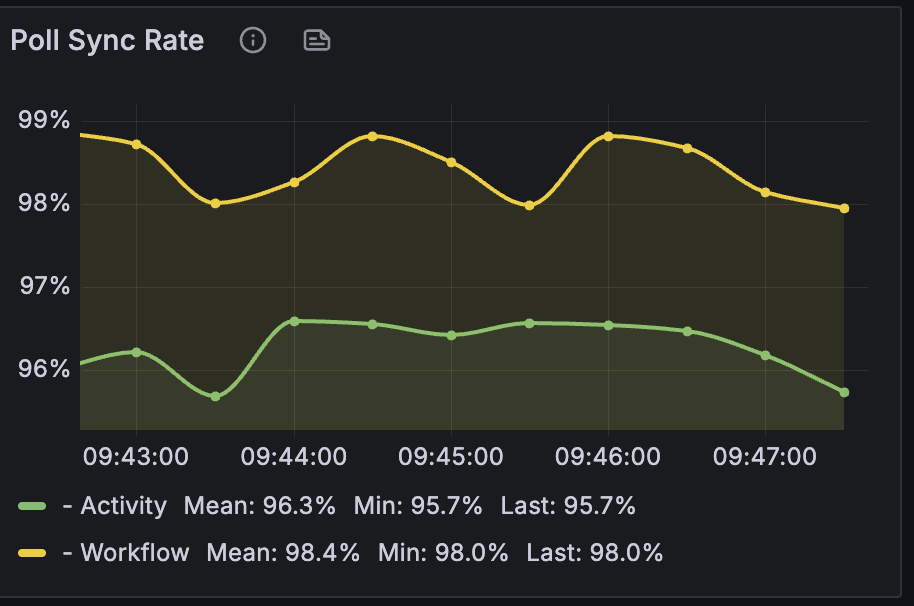
Poll Sync Rate
Measures the efficiency with which the Temporal Matching Service can immediately deliver tasks to Workers without needing to persist them to the database. This is also known as “sync match” or synchronous matching. When a Worker’s poller requests work, ideally, the Matching service can hand it a task directly from its memory.
- What it means to you as a user: A high Poll Sync Rate is crucial for optimal throughput and reduced load on your persistence database. If the Poll Sync Rate is low, it means that tasks are being flushed to the persistence database and then reloaded later, which is less efficient and increases the load on your database. This can indirectly contribute to higher latencies for your workflows if the database becomes a bottleneck.
- Target: The ideal Poll Sync Rate for both Workflow and Activity tasks should be 99% or higher. In most cases of systems with a steady load, it should be >90%, and for high volume and low latency, it should target >95%.
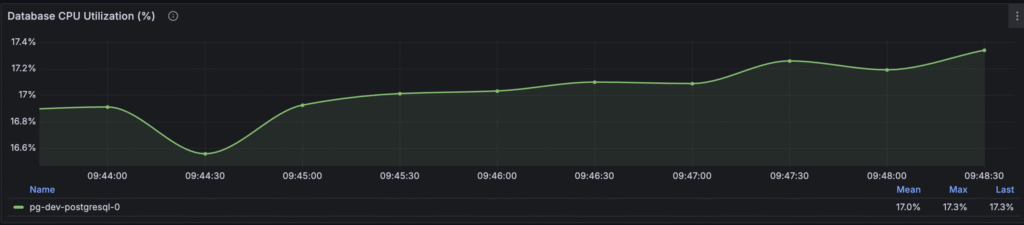
Persistence Database CPU Utilization
The persistence backend (such as Cassandra, MySQL, or PostgreSQL) is frequently the bottleneck in a Temporal cluster due to its critical role in durability and state management. Monitoring its CPU utilization and keeping it below 80% is important. If the database CPU usage is too high, it signifies that the underlying storage layer is overloaded, resulting in overall system slowdowns, increased latencies for all Temporal operations, and potential failures in your application’s workflows and activities, directly impacting reliability for your users
.
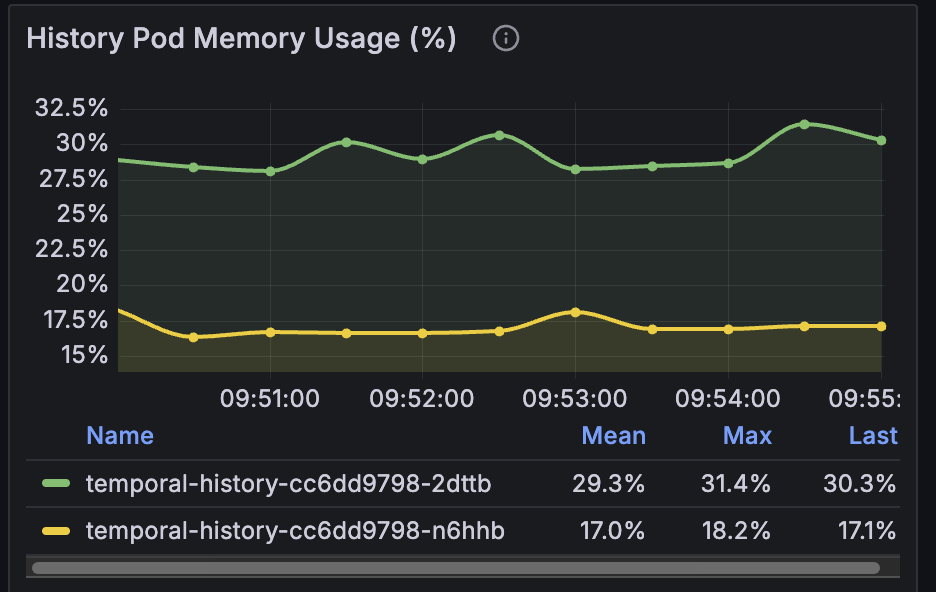
CPU utilization and memory usage for Temporal services
It’s especially important to monitor the memory usage of history services. The memory utilization of the History Service depends significantly on the workloads running on your Temporal cluster. It is also highly influenced by the number of History Shards and the per-shard cache limits. You should try to keep the memory usage for history pods below 70%. It’s the recommendation from the Temporal staff.
History Shard count
Shards represent a unit of parallelism (concurrent updates). Plays an important role in reaching our desired state transition per second. Once set, it cannot be changed for this cluster. You can set it in the temporal static config in the Helm values. Default value: 512
server:
  config:
    numHistoryShards: 2048
Recommended from the temporal team, both cluster profiles (small cluster and big): 2048 shards for the cluster.
Resources
I wrote this article using a lot of resources, but in my opinion, these three are the most important and contain more essential information:
Observability for Self-Hosted Temporal
Observability for Self-Hosted Temporal: Performance, Troubleshooting, and Optimization