Table of Contents
- Introduction
- First phase
- Second phase
- Third phase
- Forth phase
- Fifth phase
- Sixth phase
- Test with a huge payload
- A large number of replicas
- Tuning postrgres cache
- Increasing the load
- Summary
- Conclusions
Introduction
This article describes performance tests of Temporal deployed in a Kubernetes cluster.
I already described all relevant things related to temporal deployment in this article: Temporal deployment. Here, I will focus only on the results of tests.
First phase
Configuration
Initially, I deployed Temporal using the official Helm chart with the following configuration:
| Service | Replica Count | CPU Requests | Memory Requests | Memory Limits |
| frontend | 1 | 250m | 250Mi | 250Mi |
| history | 1 | 0.5 | 1Gi | 2Gi |
| matching | 1 | 250m | 250Mi | 250Mi |
| worker | 1 | 250m | 256Mi | 512Mi |
| Postgres DB | 1 | 2 | 2Gi | 2Gi |
Starting number of shards: 512 (default number)
And I run performance tests using https://github.com/temporalio/benchmark-workers/tree/main/charts/benchmark-workers
With the following performance tests configuration:
| Workflow Task Pollers | Activity Task Pollers | Workers Replica Count | Concurrent Workflows | Workflow Args |
| 100 | 100 | 3 | 10 | { “Count”: 10, “Activity”: “Echo”, “Input”: { “Message”: “test” } } |
In the initial phase, there is only one replica of each service; additionally, the load is very small, with only 10 concurrent workflows. But the number of workers is already high, 100 workflow and activity pollers, for each replica, so 300 activity/workflow pollers in total.
Result
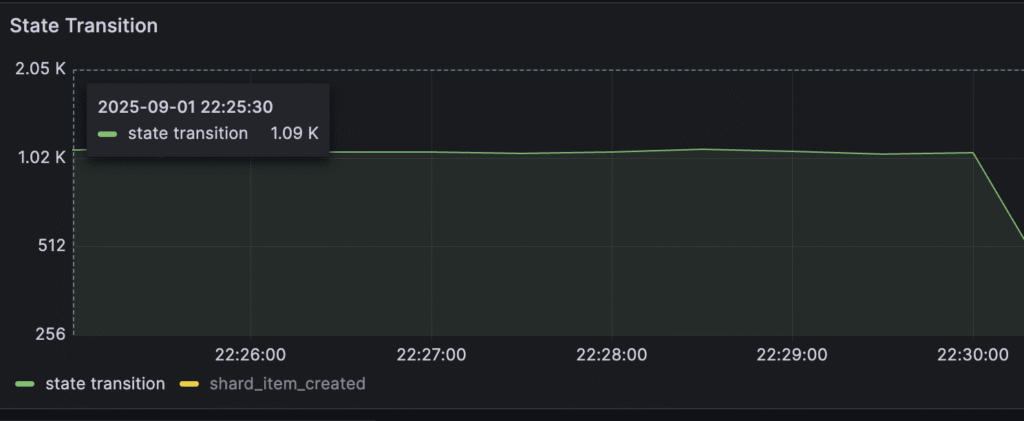
Most of the metrics look good; state transitions reached around 1k/s on average.
The only visible problem is the history pod resource usage:
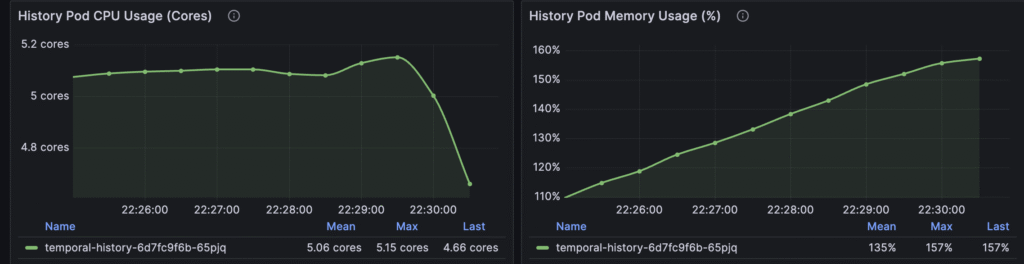
There is only one historical pod, and it consumes a lot of CPU and memory. Especially, memory usage grows linearly, and if I kept up with tests, memory usage would reach the limit in a few minutes.
Second phase
Configuration
For the second phase, I’ve increased the replication count for each service: frontend, matching, and history service from 1 to 2. Also, I drastically increased the load by changing Concurrent workflows from 10 to 100. It means that during performance tests, we try to keep 100 workflows running all the time.
Result
Most of the metrics look ok, we can reach around 1.5k/s state transitions on average per second. But Temporal started to report Resource exhausted errors:
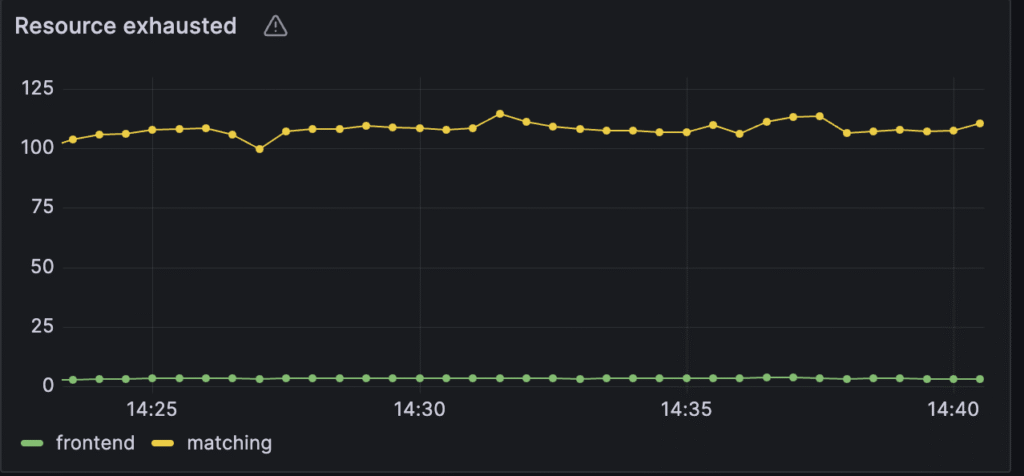
In particular, around 100 resource exhausted errors per second for the matching service and 3.5 per second for the frontend. These RPS limits need to be increased.
Third phase
Configuration
I have increased the RPS limit for the frontend and the matching service in the following way:
server:
  dynamicConfig:
    frontend.globalNamespaceRPS:
      - value: 20000   # Applies to all namespaces and frontends across the cluster, default 2400
        constraints: { }
    matching.rps:
      - value: 3000  # Applies to all matching service hosts, default is 1200 per host
        constraints: { }
Result
Errors disappeared, and the Performance of the cluster improved. Now, after adjusting rps limit, state transitions reached around 1.8k operations per second.
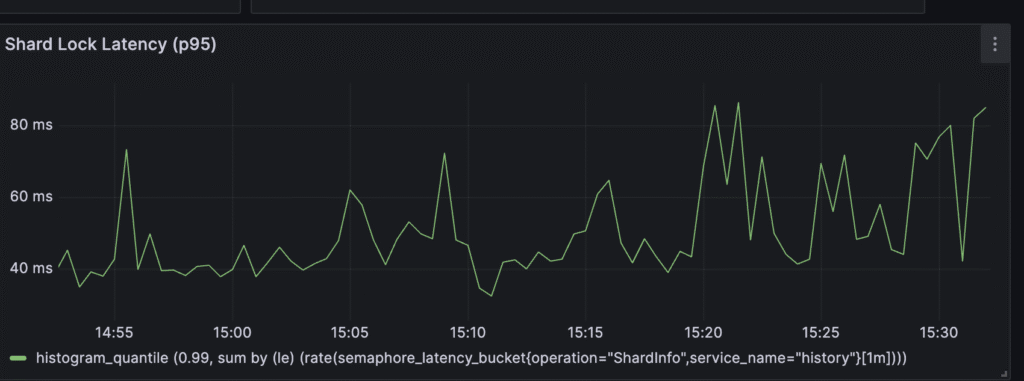
RPS is not a bottleneck anymore; there is no throttling on service level, but there are a lot of other problems:
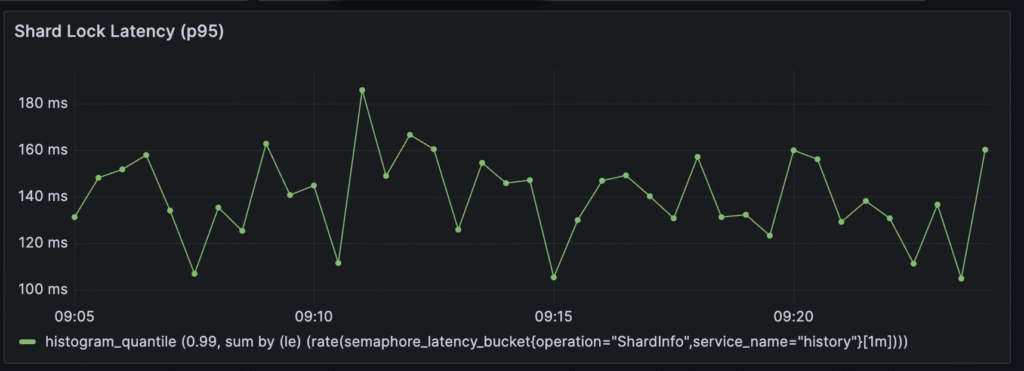
Currently, around 120-140ms is needed to obtain a shard lock. It’s very high. This value ideally should be less than 5ms.
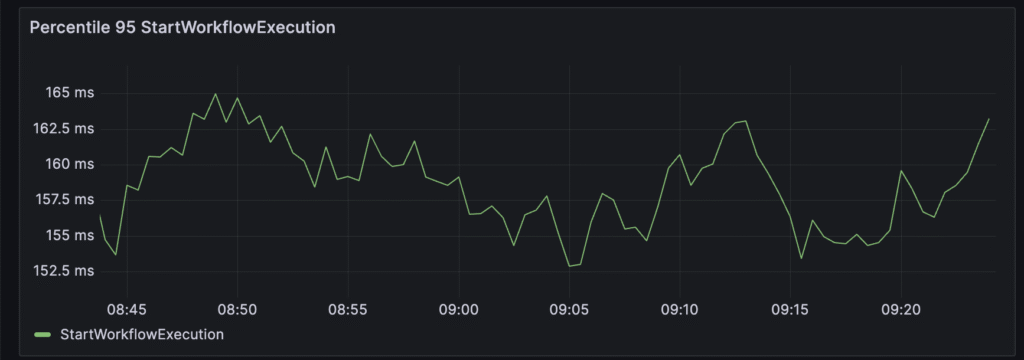
Additionally, around 160ms is needed to create a workflow. This is an operation related only to the temporal server, not workers. But by looking at shard locks, we already know that it’s related to db/shard performance.
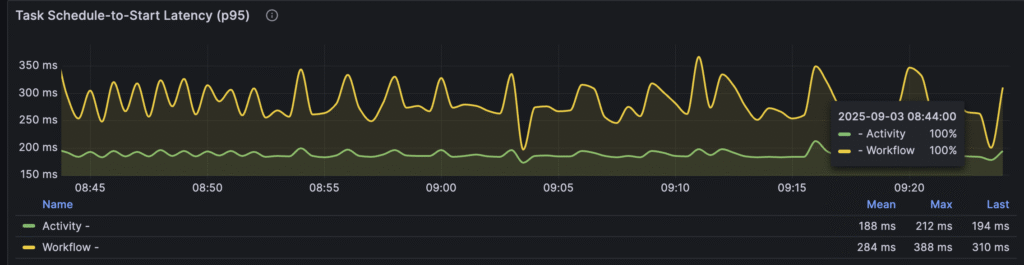
We can also see that tasks need to wait around 300ms before its polled by workers. Its indicator for us that we should increase the number of workers.
But the biggest problem can be spotted by looking at metrics related to postgersdb:
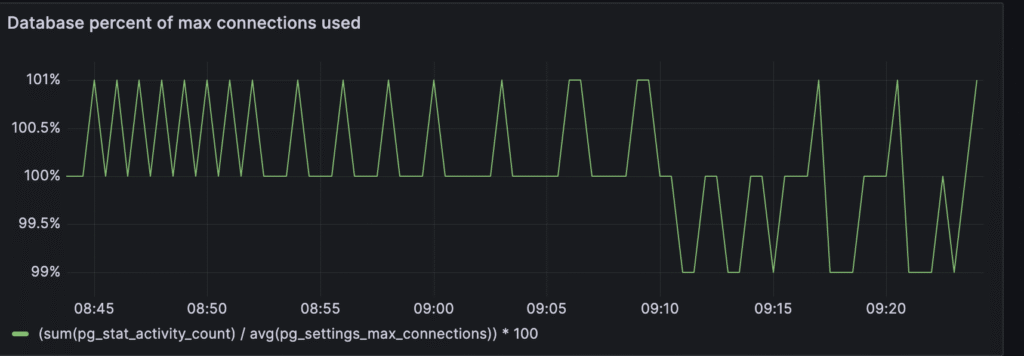
It’s visible that around 100% of the maximum connections are used. The default number for max connections in PostgreSQL is 100. So we should definitely increase this number.
Forth phase
Configuration
Let’s address all these issues. First, we should increase the number of max connections for PostgreSQL. We can do it with the helm value:
primary:
  extraEnvVars:
    - name: POSTGRESQL_MAX_CONNECTIONS
      value: "500"
  resources:
    limits:
      memory: 4Gi
Additionally, by increasing the number of connections, the RAM usage will increase, so let’s change it to 4Gi from 2Gi.
To address the “schedule to start” problem, I increased the number of workers from 3 to 4, and I increased the number of pollers from 100 to 150:
workflowTaskPollers: "150"
activityTaskPollers: "150"
The last thing was to increase the number of historical shards from 512(default) to 1024. This change requires a full cluster restart.
server:
  config:
    numHistoryShards: 1024
Result
After adjusting these settings, transitions reached around 2.2k operations per second. But there are other problems to address:
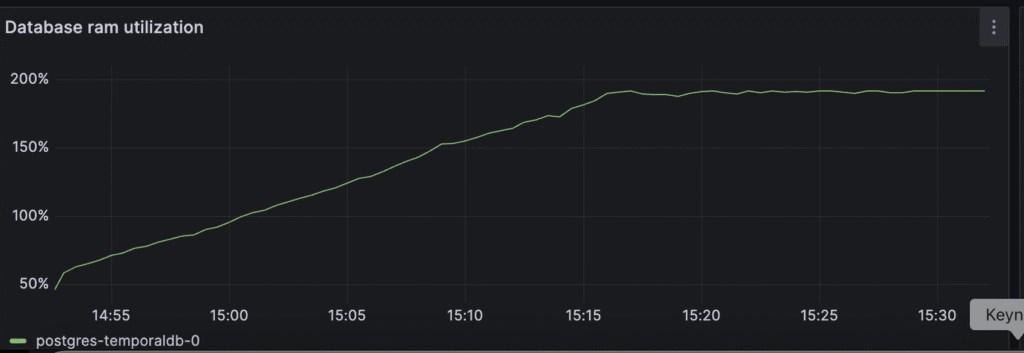
RAM usage of the Postgres DB grows really fast:
“Schedule to start” is still high. It looks like the number of workers needs to be increased:
Shard lock latency looks better than before, but it still looks like it can be improved. DB metrics look fine, so it suggests that 1024 historical shards are not enough.
Fifth phase
Configuration
I increased the number of shards from 1024 to 2048, the Number of RAM for historical pods from 3 to 4, and the RAM limit for Postgres DB from 4 GB to 6 GB.
Also, to address the problem with “scheduled to start” metrics, I increased the number of pollers from 150 to:
workflowTaskPollers: "250"
activityTaskPollers: "250"
It was also needed to increase the frontend RPS limit.
Result
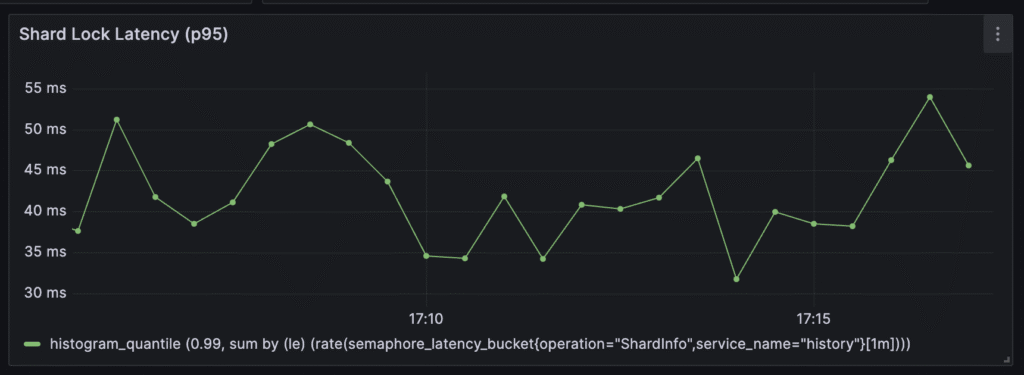
After all adjustments, the state transition per second metric reached 3k operations per second on average. which is considered a target for a small cluster, according to recommendations from the temporal team.
Shard lock latencies also decreased, and now they’re between 30 ms and 50 ms
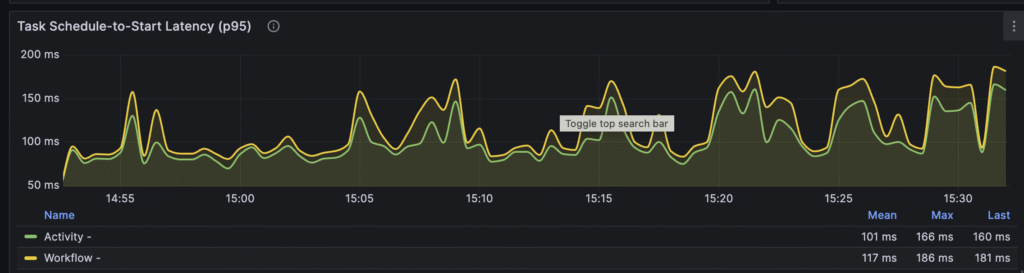
The only visible problem is the schedule-to-start latency metric:
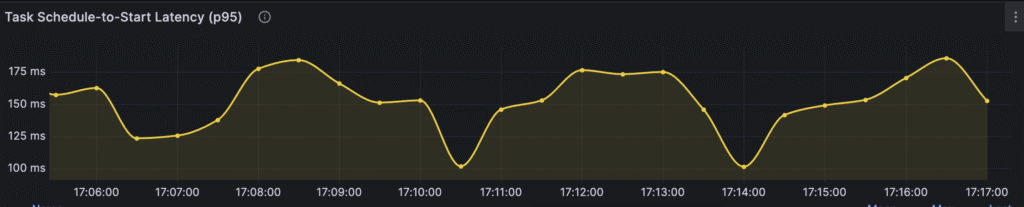
Workers need between 100 and 170ms on average to pick up a task from the task queue. Let’s try to address this issue in the last iteration.
Sixth phase
Configuration
I have changed the number of replicas for history pods from 4 to 6, Frontend replicas from 2 to 3 and matching service from 2 to 3. I also changed the frontend RPS limit to 60000
Result
Schedule-to-start latency now stays between 80 and 100ms:
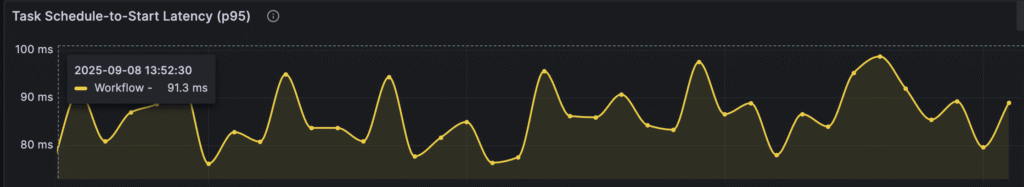
State transitions reached around 3.4k operations per second. All other metrics looks correct can finish performance tests at this point.
Test with a huge payload
Configuration
I performed additional tests by modifying workflow arguments:|
workflowArgs: '{ "Count": 10, "Activity": "Echo", "Input": { "Message": "test" } }'
Instead of “tests” in the Message section, I added a 128 KB string to simulate a big payload send for a single Temporal activity in order to verify how my current temporal deployment handles big payloads.
Result
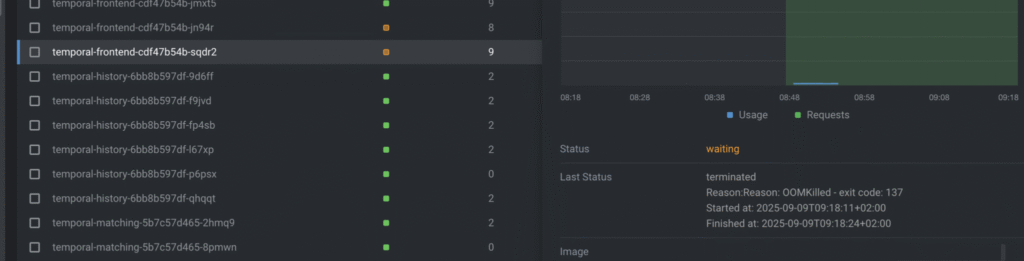
After running tests, the Temporal server was able to handle the load only for a few minutes, and after that, it was barely able to process anything:
The reason was an OOM error on the frontend level. I assigned a maximum of 256mb of RAM for each Frontend instance, and it’s not enough to process big payloads. For reminder: frontend is the gateway for the whole cluster, so each request that needs to be processed by Temporal comes through frontend
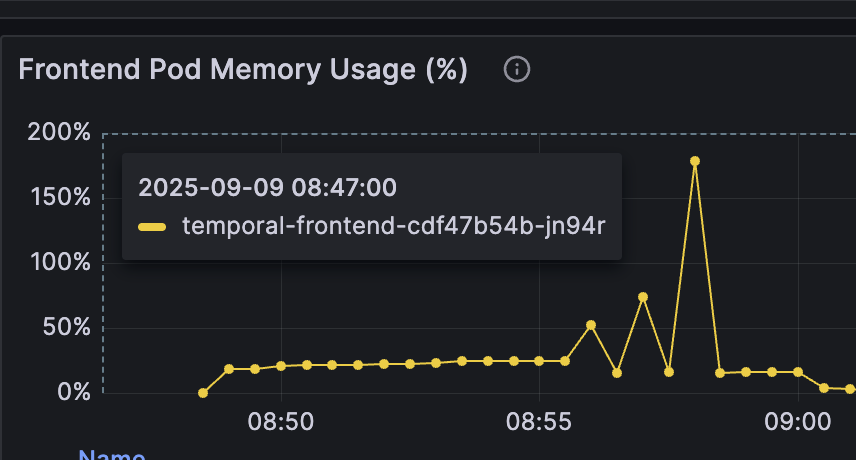
As we see, frontend pods keep restarting with the reason: OOM killed.
So to fix this problem, I increased the RAM limit for the frontend from 256mb to 2 GB:
frontend:
  replicaCount: 3
  resources:
    requests:
      cpu: 250m
      memory: 2Gi
    limits:
      memory: 2Gi
After this change, all metrics look good.
A large number of replicas
Configuration
To verify if a larger number of replicas will result in better performance, I increased frontend.globalNamespaceRPS from 40,000 to 100,000 and matching.rps from 3,000 to 9,000. And the replicaCount for the core services: the frontend service was increased from 3 to 6 replicas, the history service from 6 to 12, and the matching service from 3 to 6. And the matching service’s memory limit increased from 250Mi to 1Gi.
Result
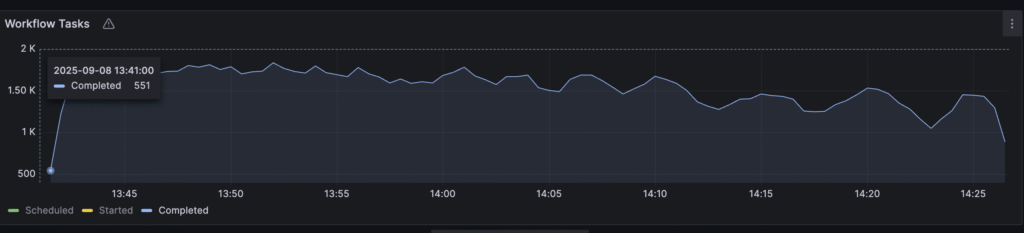
These settings didn’t improve performance. It was still around 3.4k state transitions per second. It means that our cluster reached its max capacity for this kind of load (100 concurrent workflows all the time). And adding more capacity doesn’t change anything. And Temporal was able to complete around 1.6k workflow tasks per second:
It’s also interesting to analyze persistence latency for temporal operations. In particular, “UpdateWorkflowOperation”:
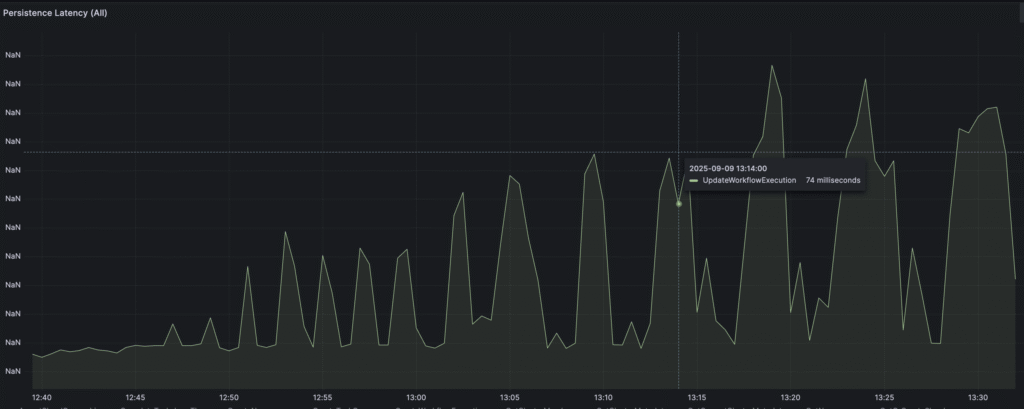
We can observe that latency is growing, which is natural because during our tests, table size and index size grow rapidly, reaching millions of records per table and gigabytes of index size, but we see a lot of spikes, which I interpret as not optimised cache size for postgresdb. It means that PostgreSQL is forced to frequently read data directly from disk, which causes spikes. Let’s try to optimize the cache for PostgreSQL and check if it will improve.
Tuning postrgres cache
Configuration
I increased the postersdb limit of RAM to match its requests:
primary:
  resources:
    requests:
      memory: 6Gi
    limits:
      memory: 6Gi
And I adjusted the cache size:
primary:
  extendedConfiguration: |-
    shared_buffers = 2GB
    effective_cache_size = 6GB
    work_mem = 32MB
    maintenance_work_mem = 512MB
Result
Persistence latency looks much better:
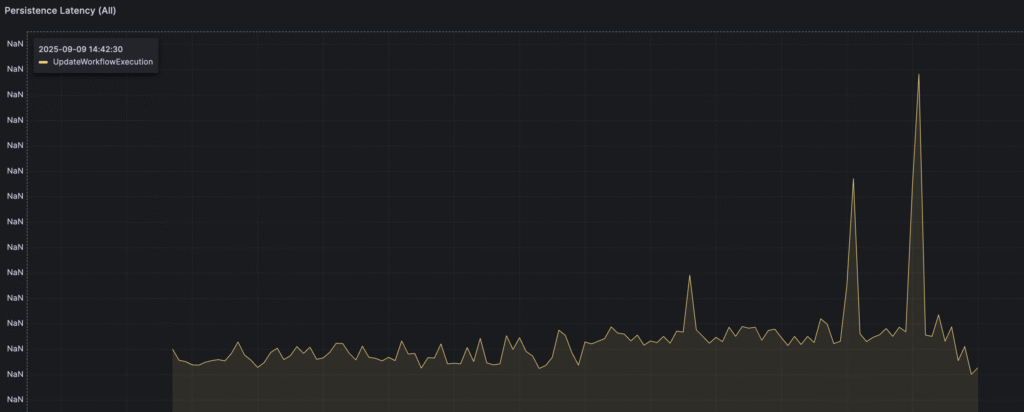
And we are able to reach around 4k state transitions per second, but after the cache is filled, it starts decreasing to around 3/3.5k. But still, it’s a big progress.
Increasing the load
Configuration
The final step was to verify cluster performance after increasing the load from 100 concurrent workflows to 200.
Result
State transitions per second reached around 4.5 operations per second.
Summary
This table represents the correlation between the number of replicas, test load, shards, and state transitions per second.
| Phase | Frontend Replicas | History Replicas | Matching Replicas | Historical Shards | Workflow/Activity Pollers | Concurrent Workflows | State Transitions per Second (Avg.) |
| First | 1 | 1 | 1 | 512 | 100 | 10 | ~1,000 |
| Second | 2 | 2 | 2 | 512 | 100 | 100 | ~1,500 |
| Third | 2 | 2 | 2 | 512 | 100 | 100 | ~1,800 |
| Fourth | 2 | 2 | 2 | 1024 | 150 | 100 | ~2,200 |
| Fifth | 2 | 4 | 2 | 2048 | 250 | 100 | ~3,000 |
| Sixth | 3 | 6 | 3 | 2048 | 250 | 100 | ~3,400 |
| Big payload | 3 | 6 | 3 | 2048 | 250 | 100 | ~2.800 |
| Multiple replicas | 6 | 12 | 6 | 2048 | 250 | 100 | ~3400 |
| DB tuning | 6 | 12 | 6 | 2048 | 250 | 100 | ~3800 |
| Load increasing | 6 | 12 | 6 | 2048 | 250 | 200 | ~4500 |
Conclusions
- During performance tests, I was focused only on server-specific metrics. Workflow logic was very simple: printing one word 10 times. In a real-world scenario, workflows are very complicated, so they can affect the server in different ways compared to such simple, repetitive operations
- It’s essential during tests to monitor database-specific metrics. And also “resource exhausted” metrics. I modified Grafana dashboards in the Kubernetes environment to monitor all these things. I also added “Postgres dashboard” and “Temporal Worker” Grafana dashboards.
- I should also perform similar tests, but this time focus on the Worker level to learn how to detect and address bottlenecks on the worker level. And how to interpret metrics.
It was observed during tests that PostgreSQL cache plays a huge role in overall cluster performance.
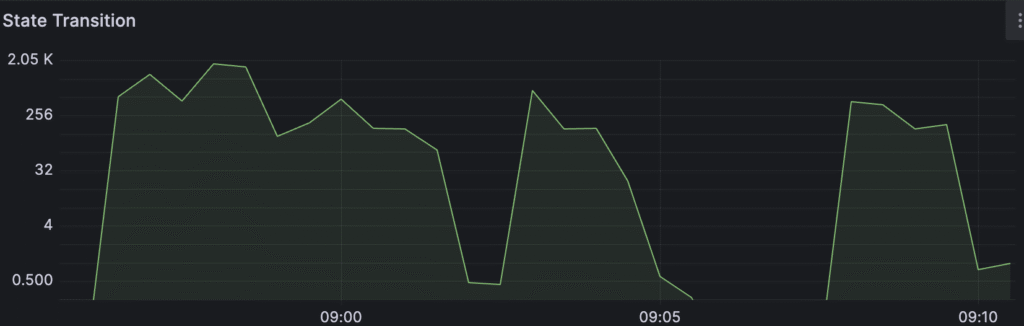
I ran the tests for about one hour, and we can always observe a slow decrease in performance, for example, for state transitions:
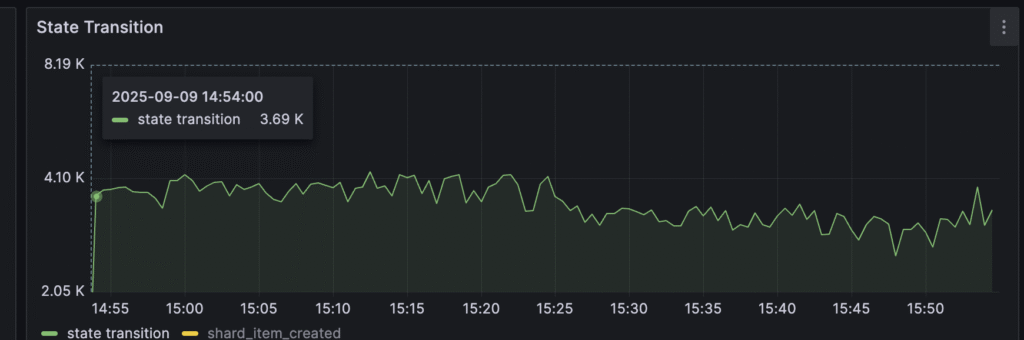
As you see, over time, metrics start decreasing. It’s related to DB size, which is linearly growing until it reaches its disk limit. For all tests, I assigned PVC with 12 GB.
Until the end of the test, the history_node table reached around 5 GB with 1 GB for the index and around 6 million rows. Decreasing performance was related to growing DB size and, in turn, slower DB operations. So DB started to be a bottleneck with its growing size.
Also, after the cache was fully filled, the DB was forced to read from disk, which in turn also decreased performance.
It’s also important to notice that during these tests, I often assigned much more resources than were needed. Another step for these tests would be to start limiting the number of pods and resources, trying to keep the same performance. Also, the number of workers I ran was definitely too big, in particular:
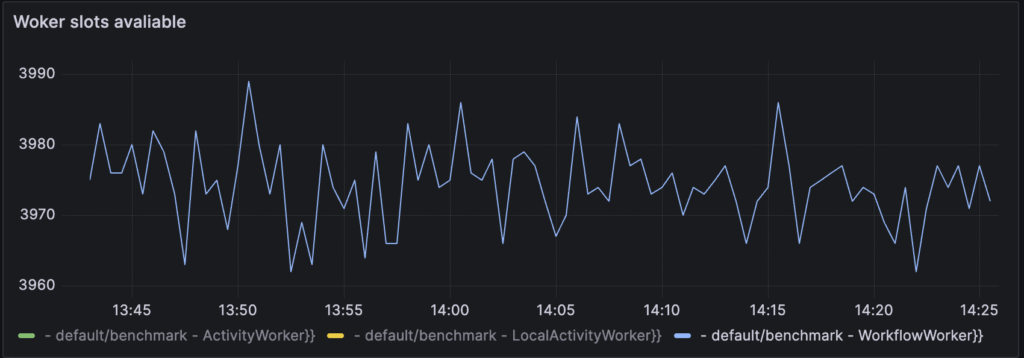
As you see on the chart, from a maximum of 4k worker slots, around 30 are used at the time. It means that the number of workers I ran was too big and can also be optimized. But during these tests, I was focused on examining cluster performance itself, so I wanted to be sure that the number of workers was not a problem.